By Joseph K. Hoereth, Matthew Sweeney, Roy Rothschild, Ojus Khanolkar, Norma Ramos
Introduction and Background
Civic engagement is an important aspect of community capacity and can be a key factor in community resilience and the overall well-being of residents. Existing measures of civic engagement have centered on individual behavior and activity. However, there is a need to better measure and understand civic engagement holistically, accounting for both individual activity and context. A more useful way to understand civic engagement in a community context is by considering individual engagement as well as the extent to which communities can organize themselves to access resources and secure the services needed by their residents. This paper describes a Civic Infrastructure Index (CII) that the authors created for the Illinois Department of Healthcare and Family Services (HFS) to measure civic capacity in a more holistic way. This article lays out the process of building the framework for the measure, describes the variables included, highlights limitations, and shares the next steps for refining and expanding the measure for use in broader contexts.
Disparities in health care provision and outcomes between different populations and regions are a persistent problem throughout the state of Illinois. In an effort to address these disparities, the Illinois Legislature passed legislation to establish the Healthcare Transformation Collaboratives (HTC) program in January 2021. This program, run by HFS, is designed to “improve healthcare outcomes, reduce healthcare disparities, and realign resources in distressed communities throughout Illinois.”1 As part of this project, HFS contracted the University of Illinois Chicago’s (UIC) School of Public Health and Institute for Healthcare Delivery Design as a partner to help launch and implement the HTC program. A primary objective of this initiative is ensuring that the program receives applications from all regions of the state.
A key challenge with this application-based system, however, is that some regions may not apply or may lack the local capacity to assemble a collaborative group, including regions that would most benefit from this program. The UIC School of Public Health tasked UIC’s Institute for Policy and Civic Engagement (IPCE) to create a civic infrastructure index with a set of measures that account for differences in the local capacity of communities across the state of Illinois to organize themselves to respond to such resource opportunities.
Civic engagement and civic infrastructure are difficult concepts to quantify and can vary based on the measurement, as well as the context in which it is used. For example, UNICEF’s Minimum Quality Standards for Community Engagement measures civic engagement using self-reported metrics, such as “Participation” and “Empowerment and Ownership.” The OECD’s Better Life Index measure of civic engagement consisted of two elements: voter turnout and stakeholder engagement of developing regulations (i.e. citizen participation in the lawmaking process). Civic infrastructure also has a symbolic meaning that extends beyond the role it plays in the health and efficacy of a community. As the William Penn Foundation describes in Civic Infrastructure: A Model for Civic Asset Reinvestment, “it affords spaces for the reproduction of society that are beyond the economic or logistical function that suffices for traditional infrastructure. It provides a platform for citizen engagement.”2 We brought these definitions and perspectives together and used multiple datasets to define measures of civic infrastructure and combine them into a single index.
Creating the Framework
Existing research of civic infrastructure definitions and measures led us to divide the full measure of civic infrastructure into three separate categories –(1) individual and household civic engagement, (2) the presence of potential HTC collaborating institutions and (3) the capacity of collaborating organizations. Since this was a measure that was made for one agency, we anticipate the data will need to be updated over the long run. Therefore, the measure consists of easily accessible data that can be regularly updated. In addition, we did not use data that was older than five years.
The measure for individual and household civic engagement consisted of census self-response rate, group membership rate, donation rate, and volunteer rate, while the measure for individual and household electoral engagement consisted of voter turnout in the 2020 elections. Presence of various organizations was calculated by the number of organizations in an area per capita, the diversity of organization types, the number of Medicaid-eligible billers per capita (this was specifically added because our measure had a health focus), and the capacity of all potential HTC collaborating organizations, which was calculated using the total payroll of the organizations used in the presence measure.
The Framework
The model was straightforward enough to be updated with publicly available data; wherever possible, the data was downloaded directly from the data sources rather than creating a separate repository. We used the North American Industry Classification System (NAICS) data, County Business Patterns data, and Census self-response data, which was downloaded directly from the U.S. Census.3 Voting data was downloaded from the MIT Election Lab.4 A list of Medicaid-eligible billers was downloaded from the Centers for Medicare and Medicaid Services.5 Civic engagement measures were downloaded from the U.S. Census Current Population Survey Volunteering and Civic Life Supplement.6 Additionally, the Social Vulnerability Index (SVI) and Childhood Opportunity Index (COI) were pulled from the Centers for Disease Control and Prevention.7 All measures included in the framework were available for every county in Illinois, except for rates of volunteering, donating, and group members. Using the U.S. Census’ Volunteering and Civic Life survey and multilevel regression with poststratification, we created county-level estimates for these measures for every county in Illinois.8
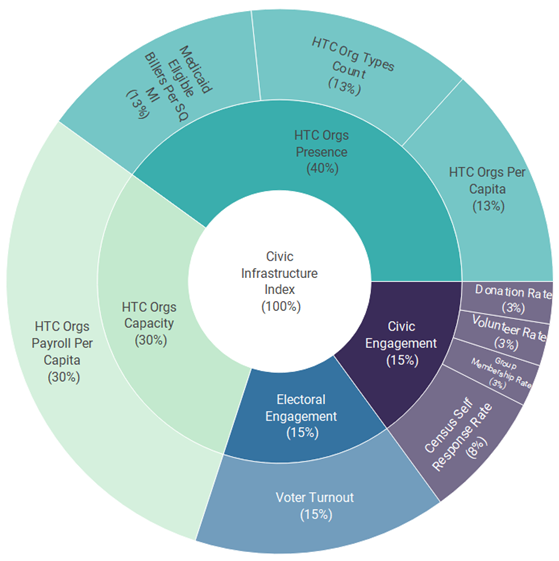
Overall, we synthesized these measures into an index of civic infrastructure resulting in the framework depicted in Figure 1, which also includes the relative weight assigned to each measure. After HFS experts reviewed this framework, they provided guidance to modify elements of the framework, especially the weighting, in order to suit their contextual use and address the relative importance they place on specific sections of the framework. The final index comprises 4 indicators: Civic Engagement, Electoral Engagement, Presence of HTC Collaborators, and Capacity of HTC Collaborators. The relative weight of each measure is listed in percentage below its label.
The measures included in the final framework include:
- Individual and Household Engagement
- Electoral Engagement
- Voter turnout
- Civic Engagement and Political Voice
- Rates of volunteering, donating, group membership, and census self-response
- Electoral Engagement
- Presence of HTC Collaborators
- The number of potential HTC collaborators by population
- The number of potential HTC collaborator types
- The number of medicaid eligible billers by area
- Capacity of HTC Collaborators
- The total payroll of potential HTC collaborators by population
Figure 1: Final Civic Infrastructure Framework
To create the CII score for each county, each variable was standardized using a “percentile rank” transformation. This is the approach used to create the SVI and puts each variable on the same scale so they may be appropriately combined into one composite score. Using the weights and structure depicted in Figure 1, the scaled variables were aggregated using a weighted arithmetic mean to create the final CII score. We applied this measure to all Illinois counties, and using this new index, we were able to chart out areas of Illinois and rank them based on their civic infrastructure score.
To create a contextual understanding for HFS, we took the score even further, combining it with the SVI to create an Opportunity Index Score that could help HFS prioritize their outreach. The SVI calculated for each county served as a measure of need for the particular county. Combining the SVI with the Civic Infrastructure index provided additional information as to which areas could be in need of support to submit applications. We also combined this with the number of HTC Applications per capita that serviced that county. Combining all these measurements shows the counties that are in most acute need of government assistance to submit applications and receive additional funding, but don’t necessarily have the civic infrastructure to apply for this aid.
Limitations and Next Steps
The index, while detailed, does have aspects that could be improved in a second version. The approach we adopted worked for the project at hand but expanding it in future iterations would likely require refining the current indicators and potentially including additional ones.
Ideally, the index would be created on a smaller level of geography than county. This level of granularity would provide a detailed sense of variation on a more local basis. In this case , other researchers on the HFS project team compiled data on individual and community health disparities at the zip code level. However, creating the measure on a smaller geographic level was not possible due to the unavailability of some data sources on a zip code level and the need to have the index apply to all geographic areas of the state. As a result, we created the index at the county level, which is consistent with data availability. A future study will likely expand to a more in-depth measure on a smaller geographic level.
Another benefit of a smaller geography would be the ability to better observe how racial and other demographic factors interact with the measure. Despite prevalent racial segregation, the population distribution in Illinois is such that county level geographies are too large to make comparisons in scores based on race. Observing these differences within counties or among groups of smaller geography such as zip code would be more useful.
A challenge of going to a smaller geographic area, however, is that it is difficult to measure the geographic bounds of service areas of institutions like hospitals. It is difficult to determine the scope of an organization’s service areas and whether it would make sense to confine those organizations to one zip code when they serve a much larger area. For example, a large university, such as the University of Illinois, doesn’t just serve the zip code it’s located in. It serves the entirety of Illinois (probably even nationally). The same applies for hospitals, especially in more rural areas. The low density of hospitals, FQHCs and other health centers means that each hospital serves a much larger area than just the zip code it is located in. There are a few potential solutions to this problem that could be implemented with increased resources and more time.
One solution we considered was to simply exclude large organizations from the calculation of capacity but to include them in presence based on a weighted measure that takes into account their distance, possibly a gradient based on distance. So a hospital would contribute a larger presence to the zip code it’s located in, and smaller presence to the neighboring zip code. In addition, the weight of distance would vary depending on whether the hospital, health center, or NPO was located in the city or in the suburbs. A hospital located in the city, where there is a higher density of hospitals, health centers and NPOs would contribute to the presence of the neighborhood one mile away much less than a health center in a rural area would contribute to the presence of a neighborhood just a mile away.
Another limitation is the ability to measure the presence and capacity of nonprofit institutions. As our model had a health focus, it was sometimes difficult to determine which types of organizations that work to reduce healthcare disparities should be included or excluded from our index. We had to decide which types of organizations would work as HTC collaborators, which was further complicated by the complex schema of organization types as defined by the U.S. Census in its NAICS codes. The index, specifically which organization types to include or exclude, will require further refining to make the model more applicable on a national scale and more generalizable beyond healthcare.
This Civic Infrastructure Index serves a first step towards developing a more quantitative and comprehensive measure of civic infrastructure and civic engagement. The framework is easily accessible, updatable and implementable without the need for survey data. These traits indicate that a CII could serve as a useful tool when applied across a range of cities and geographic areas. As stated earlier, this would mean that the framework would need to be refined and updated to suit a wide variety of conditions and geographic areas. Overall, the Civic Infrastructure Index could help illuminate key differences in civic infrastructure across communities and geographies and provide insights to community members, policymakers, and government agencies. An understanding of local capacity can also provide information as to communities’ ability to access external resources, particularly low-income communities that are most in need of government support.